Adrem NetCrunch 4.1
Adrem Software's NetCrunch 4.1 delivers robust functionality in all areas critical to network and system management, including device discovery, resource monitoring, events and alerts, short-term graphing, long-term reporting, and diagnostics. With its comprehensive feature set and intuitive interface, the product makes system management straightforward—and even enjoyable—for managers of midsize networks primarily running Windows servers.
On the downside, the data-collection engine is only available for Windows and the bundled Windows console must run on the same system as the server. However, the usable Web UI supports role-definable accounts, so users aren't limited to the Windows console.
NetCrunch is available in Premium and Premium XE editions. AdRem recommends a dedicated machine to run the XE version on networks with several hundred nodes, and the Premium edition for a network with just "a few hundred" nodes. The more scalable XE package, which we tested, is intended for complex monitoring; it has more robust recovery mechanisms and better optimization for high-end CPUs. It can map the physical network topology, suppress events if a device fails, and ignore some devices if sufficient time or bandwidth is not available to complete the sampling process within the allocated window.
NetCrunch Premium sells for $3,395, while NetCrunch Premium XE is $4,995 for one Windows console and an unlimited number of nodes—competitive with packages such as Castle Rock Computing's SNMPc and Ipswitch's WhatsUp Professional.
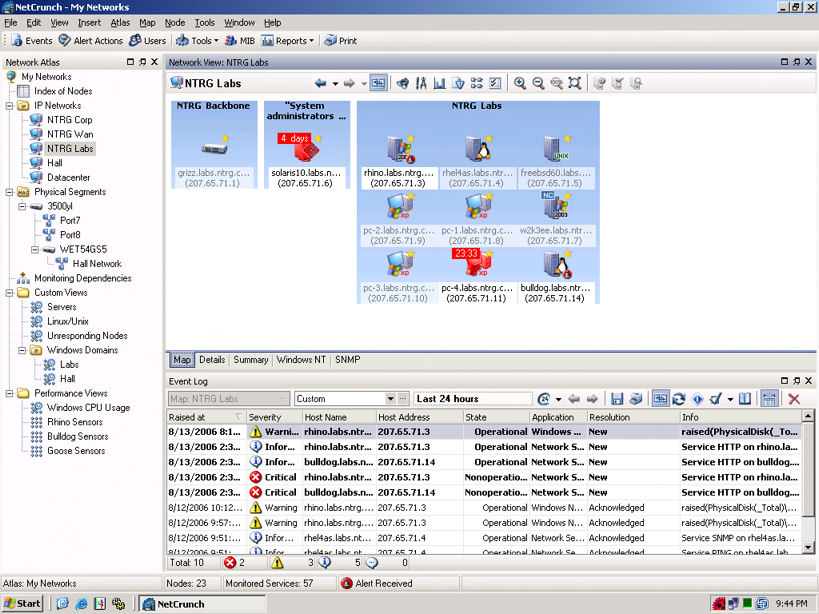
Upon start-up, NetCrunch presents a blank "atlas" of all known networks and nodes. We defined and ran a series of scans and probes to populate the atlas database and could see the resulting networks and nodes in dynamic "map" views set to our specifications.
Networks and nodes can be discovered with sequential ICMP ping messages to a specific IP subnet. SNMP 1, 2 and 3 queries, as well as NetBIOS and WMI lookups are also available. These are standard features for most network-management apps, though NetCrunch goes a step further by discovering devices registered in Novell eDirectory servers as well. Only a handful of products, such as SolarWinds' network-management software, provide this capability. NetCrunch offers wizards to help with more complicated scans and lets users add nonassociated devices to IP network maps manually.
Once the atlas database has been populated, the data is sorted into logical groupings and displayed as topology-specific maps. This feature is found especially in larger, more sophisticated management applications, such as HP OpenView and IBM Tivoli. It's also not unheard of in smaller applications, including WhatsUp Professional.
Device Monitoring
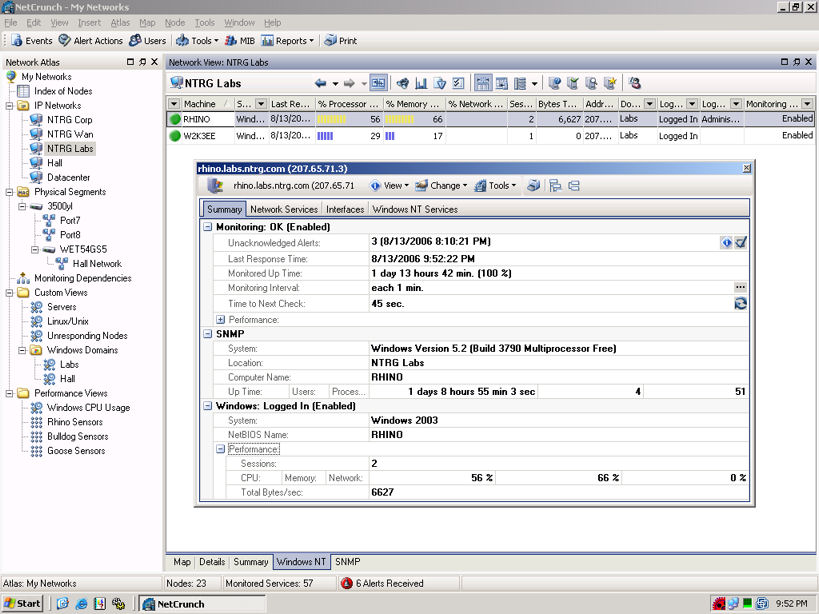
By default, NetCrunch uses ICMP ping messages to measure basic availability and also will monitor a handful of well-known TCP and UDP services. NetCrunch will read a variety of performance data from SNMP and WMI queries if those sources are available on the monitored systems. In addition, it can be configured to listen for incoming SNMP traps and SYSLOG messages: all the better to send instant notification of critical problems, instead of forcing users to wait for the next polling cycle.
NetCrunch doesn't support RMON or native WBEM-over-HTTP queries, nor does it include SNMP templates for many platforms other than Windows. Users must develop their own templates for most of their non-Windows platforms. Fortunately, NetCrunch's template editor is easy to use.
NetCrunch uses some intelligent algorithms to optimize its monitoring, ensuring that all the available bandwidth and CPU processing doesn't get consumed by the monitoring process. NetCrunch can associate whole network segments with a particular router or switch, for example, so if a critical piece of infrastructure goes down, the remote networks behind that device will be ignored until the device is restored.
Alerts, Reports And Diagnostics
NetCrunch has a broad range of actions that can be associated with events. At the simplest, a message can be popped onto the console or sent to predefined contacts over SMTP, SMS, pager, ICQ and network broadcasting. NetCrunch manipulates Windows services (such as restarting a problematic service) and can manipulate the power state of an entire PC. It also can be configured to log in to a remote system over SSH, and upload and run a custom script if some user-defined condition is met.
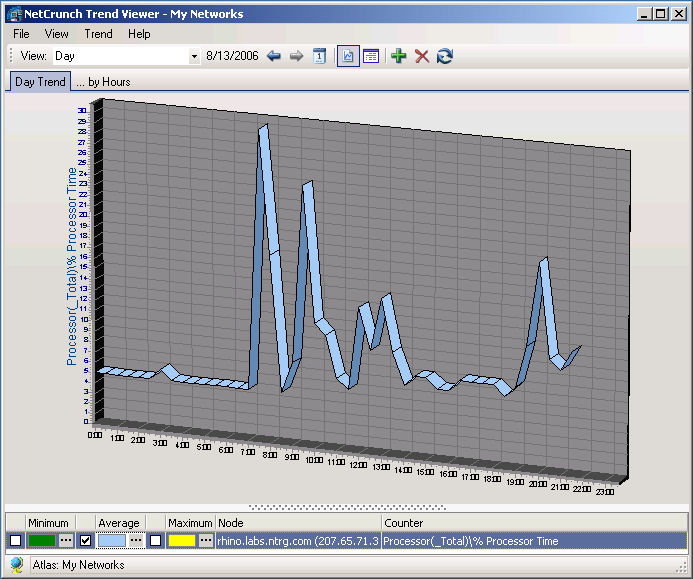
Performance readings can be fed into graphs that show recent activity, and reports can be generated to show the current and long-term performance data for any monitored resource. The graphs are single-element charts and aren't comprehensive enough to compete with specialty tools such as Cacti, but are adequate for most jobs.
NetCrunch includes a set of basic interactive tools for exploring systems, which is useful for building new monitors or when the network fails. The toolkits include standard devices, such as trace route and DNS debuggers, MIB browsers and WMI browsers. Unfortunately, these tools aren't well-integrated into NetCrunch; users can isolate a problem condition, but can't ask NetCrunch to monitor the condition state. Instead, users must rebuild the metrics inside NetCrunch separately.

Copyright © 2010-2017 Eric A. Hall.
Portions copyright © 2006 CMP Media, Inc. Used with permission.