Remotely Monitoring Memory Usage
We've all heard the mantra a thousand times: adding RAM is the easiest and most reliable way to boost the performance of a sagging system. And while that's usually true, there's a lot that goes unsaid in that homily.
For one thing, it isn't always easy to tell when you are truly running low on memory. Although Windows provides lots of information about memory utilization in various places, it still manages to obfuscate most of what you really need to know. This occurs because Windows either overloads the administrator with irrelevant information, or it hides the information that you really need in an out-of-way location.
UNIX isn't much better. The free utility that comes with UNIX-based systems usually only provides summary data, and you have to dig around in unusual places to find actionable utilization figures. As a result, administrators have a hard time conducting the kind of ongoing clinical observation that leads to true understanding of memory utilization. So most of us just salute the platitude and dump in more memory, whether it's actually needed or not.
As one example of this phenomenon, the SUSE Linux system that I use for my public Web and e-mail server originally only had 512 MB of RAM. This should have been more than adequate for the lightweight load that I was expecting, but the system tools showed that the box was constantly running low on memory. And even after I bumped it up to a full gigabyte, the system still complained.
I had just gotten ready to add another gigabyte when I discovered that most of the memory was actually being consumed by SUSE's aggressive disk-caching algorithm. Every time I added more memory, the operating system drank it up for the disk cache. In reality I was nowhere near hitting any kind of memory limit for the applications themselves, even with just 512 MB.
Windows has some behavioral oddities about the way it handles memory too. For instance, Windows XP is supposed to be able to handle up to 4 GB of RAM directly, but sometimes it can only read 3.12 GB. Meanwhile, 32-bit Windows applications have access to only two of those gigabytes by default.
Programmers have to use special APIs to make their applications access more than that (see Microsoft's KB article 888137 for more information). Without some significant tweaking by all involved parties, additional RAM beyond these built-in ceilings simply won't help.
The Tool Is Everything
Really, the first order of business is to get a handle on how well your existing memory is already being utilized before you start adding more. It may turn out that you have more memory than needed, or that your existing RAM is being underutilized by the applications that need it.
There are lots of tools for monitoring memory utilization, of course, and this includes the tools that are bundled into the operating systems themselves. However, very few tools can provide the kind of long-term, clinical data collection that is needed to form a real appreciation of your ongoing status.
For one thing, these tools are rarely able to pull in data from all of the systems on your network. Most are platform-specific or can't poll foreign systems across a network, or they can't represent the samples in a format that allows ongoing monitoring.
More importantly, most of these tools are unable to perform the basic calculations that are needed to produce meaningful information. For example, to determine how much physical memory is actually in use you may need to subtract the unallocated physical memory from the installed physical memory. In other cases, you may need to convert kilobytes to bytes (or vice versa) before you can perform any kind of arithmetic.
As I've written before, I like to use Cacti for these kinds of system-monitoring services, since it already uses SNMP to poll for system-level statistics on a fixed schedule. It also has some lightweight math capabilities built in. Better yet, I can also have Cacti call up custom PHP scripts that read in a variety of SNMP values from whatever systems I can reach. The scripts also normalize the data, perform the necessary mathematical functions, and then return formatted data back to Cacti, where the numbers are stored and turned into charts.
From there, the data can be graphed over multiple time frames, which is extremely useful for long-term and retrospective analysis. By default, Cacti polls the systems every five minutes and then generates daily, weekly, monthly, and yearly graphs. But you can also use whatever time intervals you want.
UNIX Memory Monitoring
For my UNIX-based systems, I have a PHP script that connects to each eligible system across my network and reads in a handful of predefined values. The script then calculates the amount of installed memory, the RAM that is used by the system cache, the RAM used by program buffers, and the amount of disk space that is used by the system swapfile. This data is then piped back to Cacti, where it is mapped to a series of graphs.
The Cacti template and PHP script for UNIX systems can be found here.
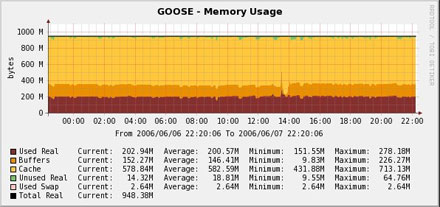
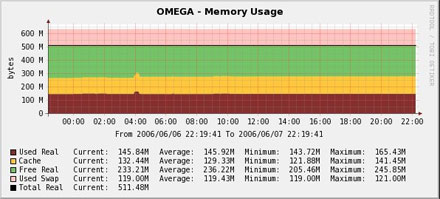
Figure 1 shows what the current 24-hour memory utilization chart looks like on my SUSE Professional 9.3 Web and e-mail server. The bulk of the memory is being used by the system cache, and not by the operating system or the applications. Even though various system tools keep showing that I'm almost out of RAM, there is plenty available for the applications to use.
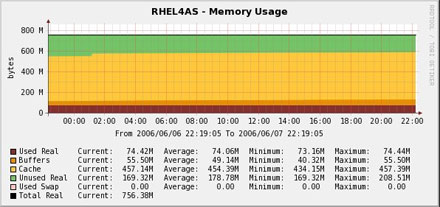
By comparison, Figure 2 shows the same chart for a local RedHat Enterprise Linux v4 server. RedHat and SUSE have substantially different algorithms when it comes to allocating cache memory. Where SUSE is very aggressive and tries to make full use of the available memory, RedHat leaves unused memory lying around in case it's suddenly needed by something. There are positives and negatives to both approaches, of course, and depending on your feelings towards either strategy, this might even be grounds for switching platforms.
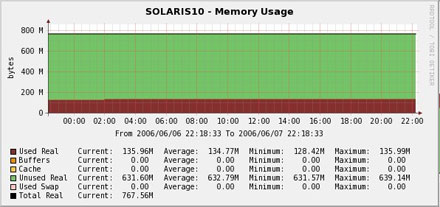
Another interesting observation comes from looking at the way that Solaris 10 reports memory. Notice that the readings for buffers, cache, and used swap are all zero. This is because the version of Net-SNMP bundled into Solaris 10 does not provide values for all these readings, so my script has to convert the null readings into numeric "zero" for Cacti to parse.
Windows Memory Monitoring
Monitoring memory on UNIX-based systems with Cacti is easy; just add Net-SNMP to your systems. Windows systems are much more complicated.
This is because Windows only provides a handful of default readings through SNMP. The rest of the data is available only through WMI, the platform-specific management interface for Windows. Although Cacti on Windows is able to read WMI data directly, Cacti on UNIX only has access to SNMP and scripts. In other words, the memory readings that we need for Windows are not published to XP's SNMP agent, but are only published to WMI.
So, reading WMI data requires that you either put a WMI agent on your Cacti box, expose the WMI data through SNMP on the managed system itself, or use some kind of middleware gateway.
In my case, I chose to convert the WMI data to SNMP by using Informant Systems' SNMP Informant Advanced. Informant Systems has a variety of SNMP extension sub-agents that can expose a large amount of WMI data through SNMP. This includes not just the operating system details, but also Microsoft Exchange data, hardware data, and more.
Informant also has a free extension agent that will expose basic system information, and another one that exposes Motherboard Monitor hardware readings. (You can read more about this subject here).
Using this WMI data gathered by Informant, my Windows-specific Cacti script is able to read the same kind of data as it gets from Net-SNMP on UNIX, and is able to calculate the same basic output. My Cacti template and PHP script for Windows can be found here.
Figure 4 shows what the memory usage on my VMware GSX server looks like, with four VMs running. The 4 GB of system RAM is almost entirely used by VMware and the operating system, with very little memory being wasted on disk cache, and almost no swap space being consumed. This is a good thing. However, given how the memory is being consumed by these four VMs, I probably need to add another couple of gigabytes to give myself some more headroom.
By comparison, Figure 5 shows what the memory usage on an old P3 server looks like. That system provides some basic network services like printing and backup, and also runs a Squid proxy server under Microsoft's Services for UNIX (the POSIX translation subsystem). Although it appears that there is lots of leftover RAM available, the relatively large amount of allocated swap space shows that the system is struggling mightily and more memory is drastically needed. Unfortunately, that motherboard can't hold any more RAM, so it looks like I'll finally donate the thing to the local school system instead.
Obviously, being able to monitor and visualize actual memory consumption can yield a tremendous amount of insight into the actual utilization of your different systems. This leads to more informed conclusions about how to get the most bang for your memory dollars. While RAM may be cheap, it's not always needed, and adding more memory when it won't actually do anything is simply wasted time, money, and effort.

Copyright © 2010-2017 Eric A. Hall.
Portions copyright © 2006 CMP Media, Inc. Used with permission.